If you work with data in Excel, you’ve likely encountered situations where you need to calculate percentages. Whether you’re analyzing sales data, financial reports, or survey results, understanding how to use Excel formulas for percentage can help you gain insights and make informed decisions. In this blog, we’ll cover some of the basic and advanced formulas you can use to calculate percentages in Excel, as well as some common use-cases and tips for effective use.
Basic Percentage Formulas
Percentage Increase/Decrease Formula
One of the most common use-cases for percentage calculations in Excel is to measure the change in a value over time. You can use the following formula to calculate the percentage increase or decrease between two values:
=(new value - old value) / old value * 100
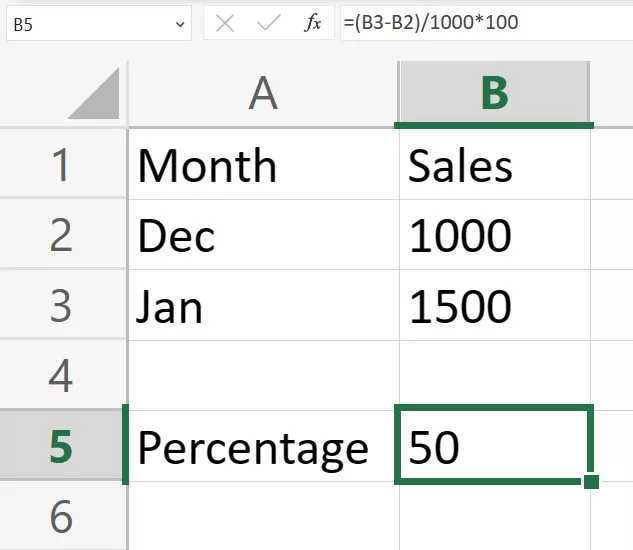
For example, let’s say you want to calculate the percentage increase in sales for the month of January compared to December. You have the following data:
Using the formula, you can calculate the percentage increase as follows:
=(1500-1000)/1000*100
=(B3-B2)/B2*100
The result is 50%, which means sales increased by 50% in January compared to December.

Percentage of Total Formula
Another common use-case for percentage calculations in Excel is to measure the percentage of a value out of a total. You can use the following formula to calculate the percentage of a value in relation to a total:
=value / total * 100
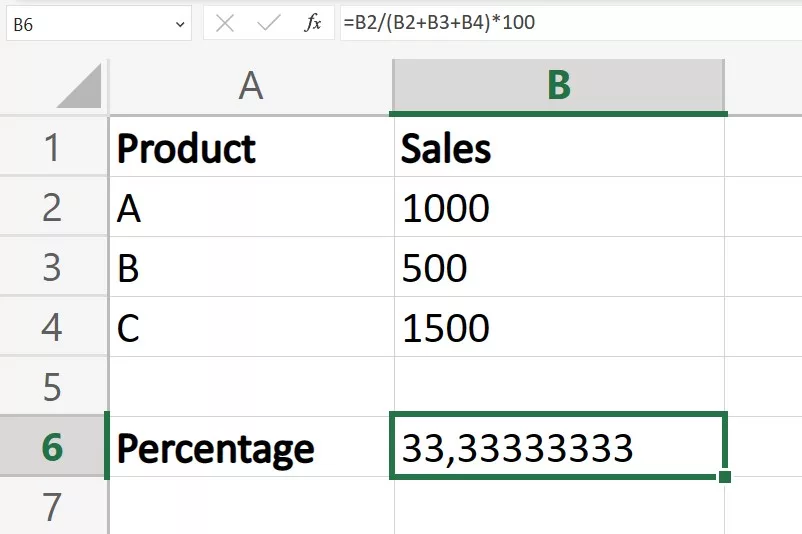
For example, let’s say you want to calculate the percentage of sales made by a particular product out of the total sales. You have the following data:
Using the formula, you can calculate the percentage of sales for product A as follows:
=1000/(1000+500+1500)*100
=B2/(B2+B3+B4)*100
The result is 33.33%, which means product A accounted for 33.33% of the total sales.


